CI/CD performance improvements using rbspy profiling
The GitLab Handbook uses a static site generator, Middleman, and whilst building the Handbook locally, I noticed it took on average 3 minutes and 30 seconds to run and tried to figure out if the build time could be improved.
Middleman is written in Ruby, and Ruby has some pretty good performance tools. A relatively new (first release was in 2018), but awesome one, is rbspy.
We can run it against the GitLab Handbook build using:
NO_CONTRACTS=true sudo --preserve-env rbspy record \
  --format=callgrind --subprocesses --rate=50 \
  bundle exec middleman build
--rate specifies the number of stack traces sampled per second. You could sample them all, but this can generate extremely large profiling output files, depending on what the code is doing, so we stick with 50 samples a second.
This generates a call tree/graph that can be interpreted by qcachegrind, and in version 4.4.0 of Middleman, looks like this:

For more information about call tree/graphs, see the Wikipedia article on the topic.
As shown in the highlighted block above, 42.5% of time is being spent inside of a single code block, performing a regular expression match 47,120 times in the sampled output. Remember this is sampled output, so the real number would be much higher.
I refactored this so the regular expression is compiled outside of the block:

and re-ran the profiled Handbook build, which showed in qcachegrind:

In our sampled output, the block was now 2.92%, down from 42.5%, and the average Handbook build time was 2 minutes and 30 seconds, a reduction of a full minute, or a ~33% improvement.
The next step was to submit a pull request to Middleman to get this change in, which landed in 4.4.2. I also created a merge request to GitLab to update their Middleman version to 4.4.2 for the www-gitlab-com repository (reponsible for building their Handbook).
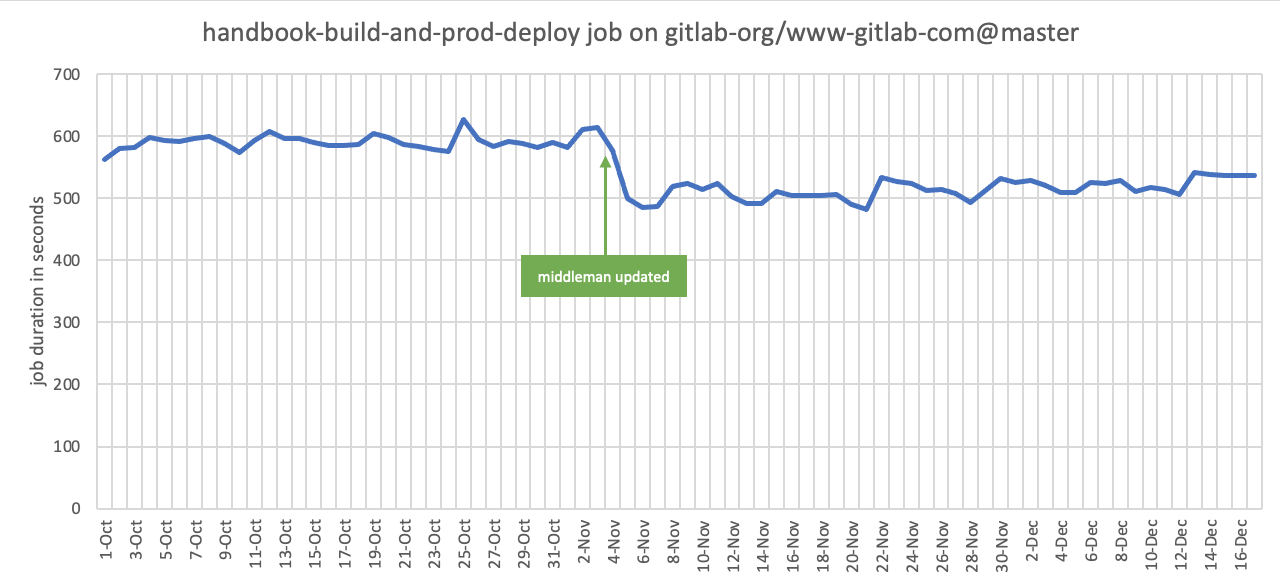
The GitLab merge request was merged in on the 4th of November, so let’s have a look at the overall pipeline improvement for the handbook-build-and-deploy job:

A noticable improvement for a simple 2 line code change!
Every now and then it’s worth profiling your long-running code to see if there’s any quick-win performance improvements that can be made, and hopefully you get as lucky as I did. :)